Current status and details of IMPRES-M®
IMPRES-M® is currently under active development on 3 separate tracks: single-subject PK, PK-TTE and population PK.
Single-subject modeling
The first track is modeling of single-subject curves. Through an R interface, the user can either load data from a file in NMTRAN specification or specify concentration and dosing information through R vectors. The amount of smoothness is selected based on AIC or leave-one-out cross-validation (LOOCV), or alternatively specified manually. Curve parameters can be stored on disk for simulation. The theoretical basis of IMPRES-M® is described in a poster that is presented during PAGE 2024 and a comparison to compartmental modeling in a separate poster; see also the below Figure. The single subject version is currently under alpha testing; beta testing is expected to start in July 2024. If you are interested, please register via the form at the bottom of this page. A pilot version of an interface to NONMEN will be demonstrated at PAGE 2024, while an interface to nlmixr is underway.
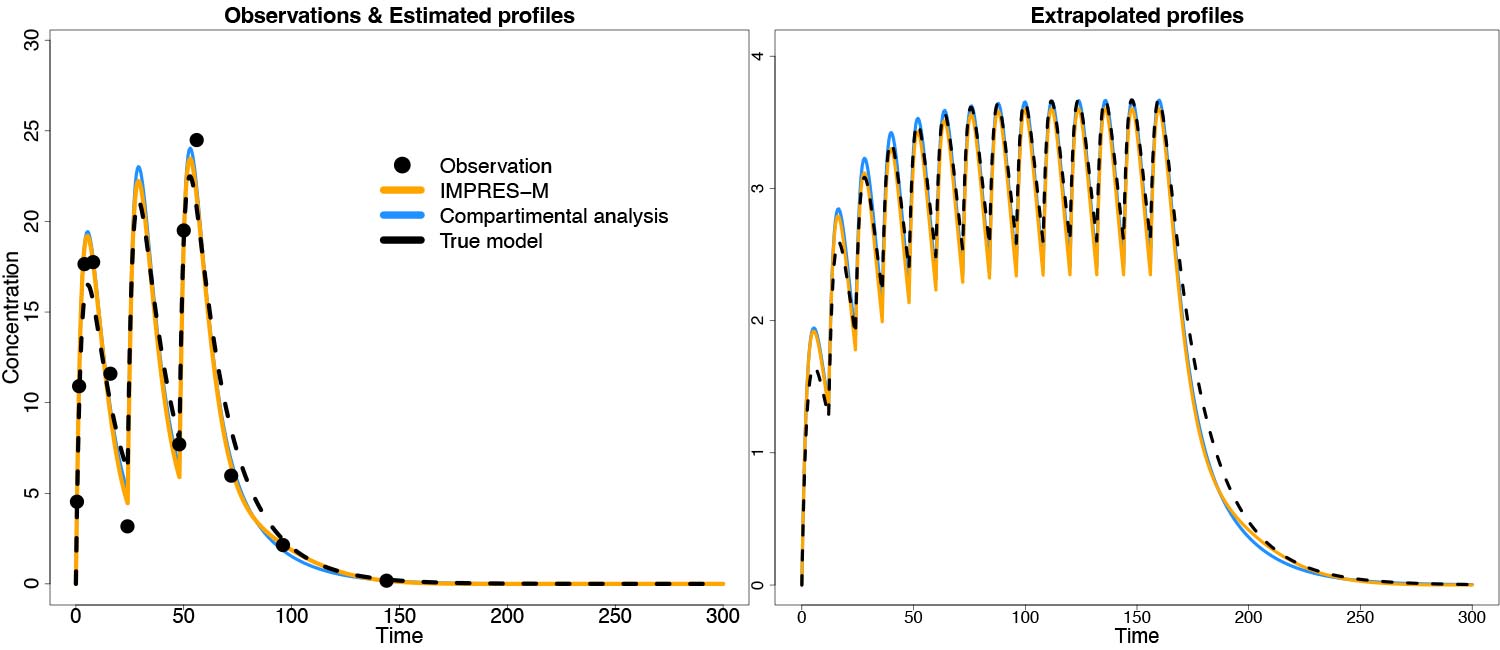
Figure 2: Estimation and prediction of PK curves with IMPRES-M® in comparison to compartmental analysis. Data were simulated under a compartmental model, and estimated with either IMPRES-M or a compartmental model. Results were comparable between the two methods.
Survival modeling
The second track of IMPRES-M® development is a form of PK-PD modeling: modeling the relation between drug exposure and the occurrence of a drug-induced effect. This family of models is called Time-To-Event (TTE) and is frequently used in oncology indications with endpoints such as progression-free (PFS) or overall survival (OS). Why is this significant? PK-TTE models are specified in differential equations, which can be difficult to handle when PK curves are input as compartmental models. TTE trials are typically months to years in duration, and the daily changes in exposure cause large numerical problems. The relationship between PK and TTE is therefore frequently specified with PK as a constant covariate, which is subject to biases related to, e.g. dosing cessation and exposure variability. We have been able to develop a method of algebraic integration with IMPRES-M®, allowing us to estimate the PK-TTE relation directly, see our poster at PAGE. We believe this to be a major step forward, and a great way to demonstrate the power of our new framework. PK-TTE is a form of PK-PD modeling, and other variations have been piloted internally to be published later. Alpha testing will commence after the beta testing phase of IMPRES-M® single-subject PK. The PK-TTE implementation will be demonstrated during PAGE 2024.
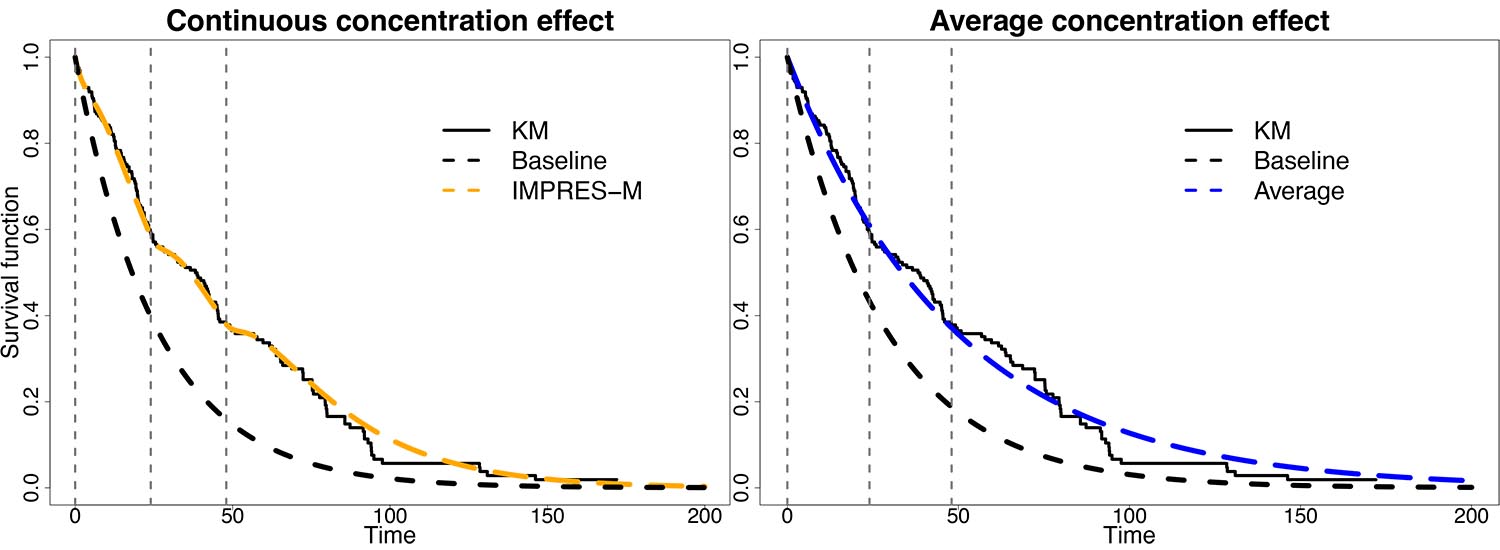
Figure 3: Example of PK-TTE modeling with IMPRES-M®. A trial of n=200 subjects are simulated and are subjected to IMPRES-M® (left) or constant-exposure covariate (right) analysis. Continuous endpoint regression avoids potential biases.
Population PK modeling
The third track of IMPRES-M® is population PK modeling. Population PK modeling is a form of nonlinear mixed effects modeling, which represents the PK curve at the median of the population and its distribution around it. IMPRES-M® uses novel approaches to similarly represent the population without the need for the specification of the complete model. The performance of the result is checked with visual predictive checks, an industry standard. The exact approach by which the population is estimated is still under development. A first pilot implementation will be demonstrated at PAGE 2024.
Register for beta testing
Want to know more?
For further introductions or to explore avenues of collaboration, please send an e-mail to jeroen@pd-value.com or see the contact page for other communication options.